REPRESENTACIÓN DE
FUNCIONES MATEMÁTICAS CON MSCHART
Programa para representar funciones matemáticas con el componente chart de Microsoft.
Creamos una aplicación introducimos los componentes que se pueden ver a continuación en la imagen, ponemos por orden comenzando por los textbox de xi ,xf y paso y luego los de los parámetros a,b,c y d.
Introducimos los optiobutton por orden (atención en el programa el 2 está cambiado por el 4).
El código será el siguiente:
Dim X(100), Y(100) As Double
Dim xi, xf, paso As Double
Dim a, b, c, d As Double
Dim i As Integer
Private Sub Command1_Click()
On Error Resume Next
xi = Text1.Text
xf = Text2.Text
paso = Text3.Text
a = Text4.Text
b = Text5.Text
c = Text6.Text
d = Text7.Text
For i = 0 To 99
X(i) = xi + i * paso
Next
If Option1.Value Then
For i = 0 To 99
Y(i) = a * X(i) + b
MSChart1.Data = Y(i)
MSChart1.RowLabel = i
Next
End If
If Option4.Value Then
For i = 0 To 99
Y(i) = a * X(i) * X(i) + b *
X(i) + c
MSChart1.Data = Y(i)
MSChart1.RowLabel = i
Next
End If
If Option3.Value Then
For i = 0 To 99
Y(i) = a * Sin(b * X(i)) + c *
Cos(d * X(i))
MSChart1.Data = Y(i)
MSChart1.RowLabel = X(i)
Next
End If
If Option2.Value Then
For i = 0 To 99
If Tan(d * X(i)) <> 0
Then Y(i) = a * Tan(b * X(i)) + c * 1 / Tan(d * X(i))
MSChart1.Data = Y(i)
MSChart1.RowLabel = X(i)
Next
End If
If Option5.Value Then
For i = 0 To 99
Y(i) = a * Exp(b * X(i)) + c *
Exp(d * X(i))
MSChart1.Data = Y(i)
MSChart1.RowLabel = X(i)
Next
End If
End Sub
Private Sub Form_Load()
xi = 0
xf = 100
paso = 1
a = 1
b = 0
c = 0
d = 0
Option1.Value = True
Text1.Text = xi
Text2.Text = xf
Text3.Text = (xf - xi) / 100
Text4.Text = a
Text5.Text = b
Text6.Text = c
Text7.Text = d
MSChart1.AutoIncrement = True
MSChart1.ColumnCount = 1
MSChart1.RowCount = 100
MSChart1.SeriesType =
VtChSeriesType3dLine
For i = 0 To 99
X(i) = xi + i * paso
Next
For i = 0 To 99
Y(i) = a * X(i) + b
MSChart1.Data = Y(i)
MSChart1.RowLabel = X(i)
Next
End Sub
Private Sub Text1_Change()
On Error Resume Next
If Text1.Text = ""
Then Text1.Text = 0
xi = Text1.Text
paso = (xf - xi) / 100
Text3.Text = paso
End Sub
Private Sub Text2_Change()
On Error Resume Next
If Text2.Text = ""
Then Text2.Text = 0
xf = Text2.Text
paso = (xf - xi) / 100
Text3.Text = paso
End Sub
Private Sub Text3_Change()
On Error Resume Next
If Text3.Text = ""
Then Text3.Text = 0
paso = Text3.Text
xf = xi + paso * 100
Text2.Text = xf
End Sub
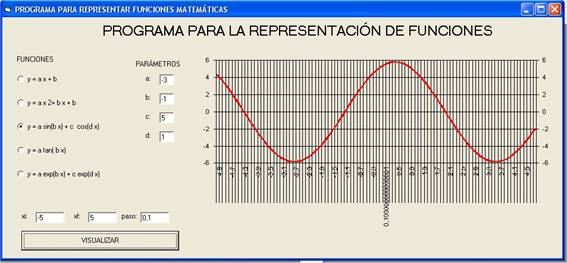
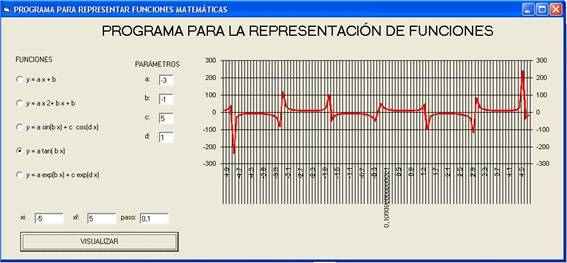
Obtenemos los siguientes resultados:
UNOS DETERMINADOS VALORES PARA a,b,c y d y vemos los diferentes resultados:
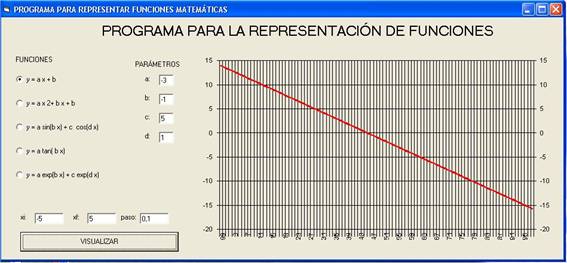
FUNCIÓN LINEAL: y = -3 x - 1
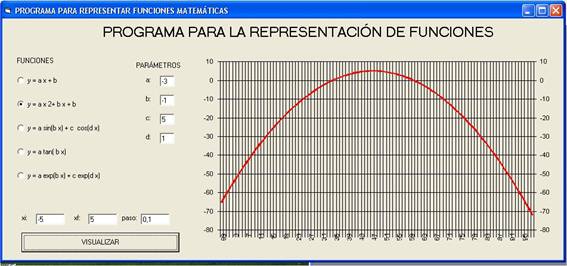
FUNCIÓN PARABÓLICA: y = -3 x2 - x + 5
FUNCIÓN SENOIDAL: y = -3 sin( - x) + 5 cos(x)
FUNCIÓN TANGENTE: y = -3tan(- x) - 1/tan(x)
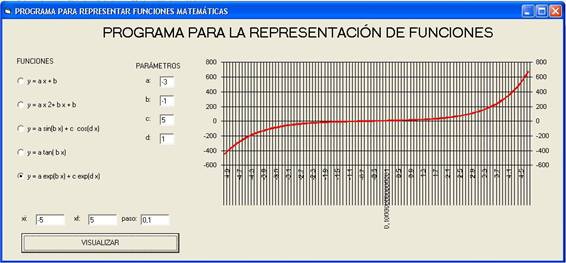
FUNCIÓN EXPONENCIALES: y = -3 exp( - 1) + 5 exp(x)