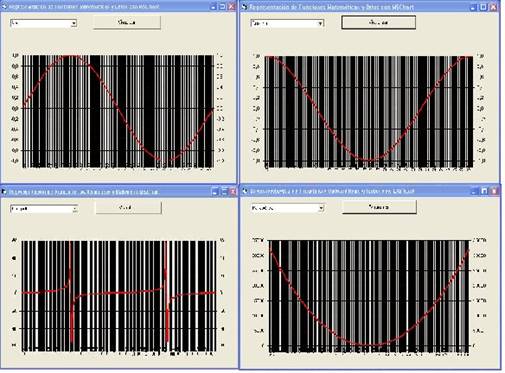
REPRESENTACION GRÁFICA DE DATOS Y FUNCIONES MATEMÁTICAS CON MSCHART
En un formulario insertamos un combo, un botón con el texto visualizar y añadimos un objeto MSChart a la barra de herramientas y al formulario.
Él código será el siguiente:
Dim X() As Double
Dim Y() As Double
Dim i
As Integer
Private Sub Command1_Click()
'inicio los valores del eje x a x
For i
= 0 To 360
X(i) = i
Next i
'si la funcion
es el seno
If Combo1.Text =
"Seno" Then
For i
= 0 To 360
Y(i) = Sin(X(i) * 3.141592 /
180)
Next i
End If
'si la funcion
es el coseno
If Combo1.Text = "Coseno" Then
For i
= 0 To 360
Y(i) = Cos(X(i) * 3.141592 / 180)
Next i
End If
'si la funcion
es el tangente
If Combo1.Text = "Tangente" Then
For i
= 0 To 360
If i
<> 90 And i <> 270 Then Y(i) = Tan(X(i)
* 3.141592 / 180)
Next i
End If
'si la funcion
es el parabólica
If Combo1.Text = "Parabólica" Then
For i
= 0 To 360
Y(i) = (X(i) - 180) ^ 2
Next i
End If
'si la funcion
es el inversa
If Combo1.Text = "Inversa" Then
For i
= 0 To 360
If i
<> 180 Then Y(i) = 1 /
(X(i) - 180)
Next i
End If
'dibujamos la funcion
en el MSChart
With MSChart1
'tendrá un valor por cada columna
.ColumnCount = 1
'tendrá 360 valores en el eje x
.RowCount = 360
'incrementará los valores automáticamente
.AutoIncrement = True
'damos los valores respectivos
For i = 0 To 359
'escribimos sobre el eje y los valores
.Data = Y(i)
'escribimos sobre el eje x los números
.RowLabel
= X(i)
Next i
End With
End Sub
Private Sub Form_Load()
ReDim X(360)
ReDim Y(360)
Combo1.Text =
"Seno"
Command1_Click
End Sub